Senin, 24 April 2017

CH241: Particle Technology Part 2 Spring – 2014


Size measurement with fine particles

  • Dry screening is useful for sizing particles with diameter greater than about 44 μm (325 mesh).
  • Wet screen analysis can be used for diameters down to 10 μm.
  • Optical microscopy and gravity sedimentation are used with particles 1 – 100 μm.
  • Coulter counter, a device used for sizing and measuring particles by measuring change in resistivity of an electrolyte as it carry particle one by one through a small orifice.
  • Light scattering techniques, sedimentation in centrifuges and electron microscopy are other useful method for measuring size of even smaller particles.
Particulate Solids In Bulk
  • Masses of solid particles, especially when they are dry and not sticky, have many properties of a fluid.
  • They exert pressure on sides of walls of container.
  • They flow through opening or inclined plane / channel.
  • Depending upon the flow property particulate solids are divided into two classes, cohesive (wet clay, reluctant to flow through opening) and non-cohesive (grains, dry sand, plastic chips etc readily flow out of bin or silo).
  • They differ from liquid and gasses in several ways because of particles interlocked at high pressure.
  • Before the mass of tightly packed particles can flow, it must increased in volume to permit interlocking grains to move past one another.
Voidage
  • Voidage is the fraction of the total volume which is made up of the free space between the particles and is filled with fluid.
  • One of the most important characteristics of any particulate mass.
  • Voidage is the fraction of the total volume which is made up of the free space between the particles and is filled with fluid.
  • Voidage corresponds to density of packing of the particles.
  • In general, isometric particles, will pack more densely than long thin particles or plates.
  • The more rapidly material is poured on to a surface or into a vessel, the more densely will it pack.
  • If it is then subjected to vibration, further consolidation may occur.
  • The packing density or voidage is important in that it determines the bulk density of the material.
  • It affects the tendency for agglomeration of the particles.
  • It critically influences the resistance offers to the fluid flowing through it as for example in filtration.
Agglomeration
  • Agglomeration arises from interaction between particles, as a result of which they adhere to one another to form clusters.
  • The main mechanisms giving rise to agglomeration are:
    • Mechanical interlocking: This can occur particularly if the particles are long and thin in shape, in which case large masses may become completely interlocked.
    • Surface attraction: Surface forces, including van der Waals’ forces, may give rise to substantial bonds between particles, particularly where particles are very fine (<10 μm), with the result that their surface per unit volume is high. In general, freshly formed surface, such as that resulting from particle fracture, gives rise to high surface forces.
    • Plastic welding: When irregular particles are in contact, the forces between the particles will be applied on extremely small surfaces and the very high pressures developed may give rise to plastic welding.
    • Electrostatic attraction: Particles may become charged as they are fed into equipment and significant electrostatic charges may be built up, particularly on fine solids.
    • Effect of moisture: Moisture may have two effects. Firstly, it will tend to collect near the points of contact between particles and give rise to surface tension effects. Secondly, it may dissolve a little of the solid, which then acts as a bonding agent on subsequent evaporation.
    • Temperature fluctuations: give rise to changes in particle structure and to greater cohesiveness.
Pressure in particulate solids


  • The exerted pressure is not same in all directions. In general the pressure applied in one direction creates some pressure in other directions.
  • The minimum pressure in solid masses is in the direction normal to that of applied pressure.
  • In homogenous masses the ratio of normal pressure to applied pressure is constant which is the characteristic of material which depends on:
    • shape and interlocking tendency of particles,
    • stickiness of grain surfaces,
    • and degree of packing.
  • It is nearly independent of particle size until the grain become very small and material is no loner free-flowing.
Angle of repose
  • When the granular solid are piled up on a flat surface, the sides of the pile are at a definite reproducible angle with the horizontal. This angle is called angle of repose of that material.
  • If solid is poured  from a nozzle on to a plane surface, it will form an approximately conical heap and the angle between the sloping side of the cone and the horizontal is the angle of repose. When this is determined in this manner it is sometimes referred to as the dynamic angle of repose or the poured angle.
  • The angle of repose may also be measured using a plane sheet to which is stuck a layer of particles from the powder. Loose powder is then poured on to the sheet which is then tilted until the powder slides. The angle of slide is known as the static angle of repose or the drained angle.
  • Angles of repose vary from about 20◦ with free-flowing solids, to about 60◦ with solids with poor flow characteristics.
  • Powders with low angles of repose tend to pack rapidly to give a high packing density.
  • An angle which is similar to the static angle of repose is the angle of slide which is measured in the same manner as the drained angle except that the surface is smooth and is not coated with a layer of particles.
  • A measure of the frictional forces within the particulate mass is the angle of friction.
  • The angle of friction is important in its effect on design of bin and hoppers.
  • If the pressure at the base of a column of solids is measured as a function of depth, it is found to increase approximately linearly with height up to a certain critical point beyond which it remains constant.
  • For heights greater than Lc the mass of additional solids is supported by frictional forces at the walls of the hopper.
Storage of Solids

Coarse solid like gravel, sand and coal are stored outside in large pile unprotected from weather. 
Solids that are two valuable and soluble on expose to outdoor piles are stored in bins, hoppers or silos.


  • When hundred and thousands of tons of solids are involved then storing out door in a pile is the most economical method.
  • Valuable solids are stored in bins, hoppers or silos.
  • These are cylindrical or rectangular vessel of concrete or metal.
    • Silo is tall relatively small in diameter.
    • Bin is not very tall but fairly wide.
    • Hopper is small vessel with sloping bottom.
  • Silos and bins are used storage for some period of time while hoppers are used for temporary storage before feeding solid to the process.
  • All these container are loaded from top by some kind of elevator; discharging is from the bottom. 
  • The major problem in solid storage vessel design is to provide satisfactory discharge.
Flow of solids in hoppers
  • Discharge from the hopper takes place through an aperture at the bottom of the cone, and difficulties are commonly experienced in obtaining a regular, or sometimes, any flow.
  • Commonly experienced types of behavior are shown in Figure 1.15.
  • Bridging of particles may take place and sometimes stable arches (b) may form inside the hopper. These can usually be broken down by vibrators attached to the walls.
  • A further problem which is commonly encountered is that of “piping” or “rat-holing”(c), in which the central core of material is discharged leaving a stagnant surrounding mass of solids. As a result some solids may be retained for long periods in the hopper and may deteriorate.
  • Ideally, “mass flow” (a) is required in which the solids are in plug flow and move downwards in masse in the hopper. The residence time of all particles in the hopper will then be the same.
  • In general, tall thin hoppers give better flow characteristics than short wide ones and the use of long small-angle conical sections at the base is advantageous.
  • The nature of the surface of the hopper is important and smooth surfaces give improved discharge characteristics. 


Discharge rate, measurement and control of solids flowrate

Jumat, 21 April 2017

CH241: Particle Technology Part 1 Spring – 2014


Introduction
  • Particle technology is a term used to refer to the science and technology related to the handling and processing of particles.
  • Particle technology is also often described as powder technology, particle science and powder science.
  • Particles are commonly referred to as bulk solids, particulate solids and granular solids
  • Today particle technology includes the study of liquid drops, emulsions and bubbles as well as solid particles.
  • This course is however limited only to solid particles.
  • The discipline of particle technology now includes topics as diverse as the formation of aerosols to the design of bucket elevators, crystallization to pneumatics transport, slurry filtration to silo design.
Importance
  • Solids used in chemical industries are most commonly  in form of particles.
  • Solids in general are more difficult to handle then liquid and gases.
  • In process industries solid appear in variety of forms, they may be hard and abrasive, tough and rubbery, soft and fragile, dusty and cohesive, Free flowing or sticky.
  • Particulate materials, powders or bulk solids are used widely in all areas of the process industries, for example in the food processing, pharmaceutical, biotechnology, oil, chemical, mineral processing, metallurgical, detergent, power generation, paint, plastics and cosmetics industries.
  • So the knowledge of their properties, handling, storage, transportation, separation and processing is important from chemical engineering point of view.
Course Content
  • Introduction to the subject.
  • Characterization of solid particles (size, shape and density).
  • Fundamentals of solid handling (conveying and storage).
  • Mixing
  • Size reduction (crushing and grinding).
  • Size enlargement (crystallization, pelletization, and granualization).
  • Motion of particles in a fluid.
  • Separation techniques
  • Screening and Sieving (for solid – solid separation)
  • Sedimentation and Filtration (for solid – liquid separation)
  • Gas cleaning (for solid – gas separation)
Books to be consult 
  • Coulson & Richardson’s Chemical Engineering by J F Richardson & J H Harker with J R Backhurst. Volume 2, Fifth Edition.
  • Units Operations of Chemical Engineering by Warren Lee McCabe, Julian Smith & Peter Harriott. Seventh Edition.
  • Introduction to Particle Technology by Martin Rhodes. Second Edition.
1. Characterization of Solid Particle
Individual solid particles are characterized by their size, shape and density.
Size and shape are easily specified for regular particles, such as spheres and cubes, but for irregular particles ? 
Why measure particle properties?
  • Better control of quality of product (cement, urea, cosmetics etc)
  • Better understanding of products, ingredients.
  • Designing of equipment for different operations such as crushing, grinding, conveying, separation, storage etc.
Which particle properties are important to measure?
  • In addition to chemical composition, the behavior of particulate materials is often dominated by the physical properties of the constituent particles.
  • These can influence a wide range of material properties including, for example, reaction and dissolution rates, how easily ingredients flow and mix, or compressibility and abrasivity.
  • From a manufacturing and development perspective, some of the most important physical properties to measure are:
    • Particle size
    • Particle shape
    • Surface properties
    • Mechanical properties
    • Charge properties
    • microstructure
1.1. Particle shape
  • The shape of an individual particle is expressed in terms of the sphericity which is independent of particle size.
  • Sphericity is the ratio of surface area of sphere of same volume as particle to the surface area of particle.
  • So for spherical particle sphericity is equal to one.
  • For non-spherical particle it is defined by:
    • Dp: equivalent diameter of particle
    • Sp: surface area of one particle
    • vp: volume of one particle
  • The equivalent diameter is sometimes defined as the diameter of a sphere of equal volume.
  • For fine particles, Dp is usually taken to be the nominal size based on screen analysis or microscopic analysis.
  • The surface area is found from adsorption measurements or from the pressure drop in a bed of particles.
  • For many crushed materials, Sphericity is between 0.6 and 0.8. For particles rounded by abrasion, their sphericity may be as high as 0.95.
  • Exercise: Determine the sphericity of a particle of surface area 15 mm2 and volume 2 mm3.

1.2. Particle size
  • By far the most important physical property of particulate samples is particle size.
  • Particle size measurement is routinely carried out across a wide range of industries and is often a critical parameter in the manufacturing of many products.
  • Particle size has a direct influence on material properties such as:
    • Reactivity or dissolution rate e.g. catalysts, tablets
    • Stability in suspension e.g. sediments, paints
    • Efficacy of delivery e.g. asthma inhalers
    • Texture and feel e.g. food ingredients
    • Appearance e.g. powder coatings and inks
    • Flowability and handling e.g. granules
    • Viscosity e.g. nasal sprays
    • Packing density and porosity e.g. ceramics.
  • In general "diameter" may be specified for any equidimensional particles (e.g. emulsions or bubbles).
  • Most of the solid particles used in industries are not equidimensional, therefore cannot be specified by a single dimension i.e. “diameter”.
  • In order to simplify the measurement process, it is often convenient to define the particle size using the concept of equivalent spheres.
  • In this case the particle size is defined by the diameter of an equivalent sphere having the same property as the actual particle such as volume or mass for example.
  • The equivalent sphere concept works very well for regular shaped particles.
  • However, it may not always be appropriate for irregular shaped particles, such as needles or plates, where the size in at least one dimension can differ significantly from that of the other dimensions.
  • Such particles are often characterized by the second longest major dimension. For example needle like particles, Dp would refer to the thickness of the particle, not their length.
  • Units used for particle size depend on the size of particles.
    • Coarse particles: inches or millimetres
    • Fine particles: screen size
    • Very fine particles: micrometers or nanometers
    • Ultra fine particles: surface area per unit mass, m2/g
1.3 Mixed particle sizes and size analysis
  • In a sample of uniform particles of diameter Dp, the total volume of the particles is m/ρp, where m = mass of the sample,  ρp = density. Since the volume of one particle is vp, the total number of particle in the sample is:
  • The total surface area of the particles is:
To apply the above two equations to mixtures of particles having various size and densities, the mixture is sorted into fractions, each of constant density and approximately constant size.
  • Each fraction can then be weighed, or the individual particles in it can be counted or measured by any of the number of methods.
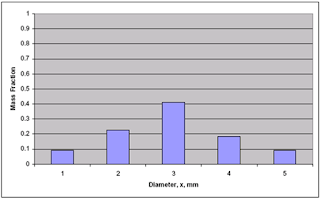
  • Information from such a particle size analysis is tabulated to show the mass fraction in each size increment as a function of average particle size. The analysis tabulated in this way is called differential analysis.
  • A second way to present the information is through a cumulative analysis obtained by adding, consecutively, the individual increments, starting with that containing the smallest particles, and tabulating or plotting the cumulative sums against the maximum particle diameter in the increment.
  • Differential Analysis

  • Cumulative Analysis

  • Mass Quantities of sample of particles

  • Mass fractions from data in previous figure.

  • Cumulative mass fraction plot of data from previous figure.

1.4. Specific surface of mixture
  • If the particle density ρp and spericity Φs are known, the surface area of particles in each fraction can be calculated and added to give the specific surface, Aw (The total surface area of the unit mass of particles):
  • Where xi   = mass fraction in a given increment, Dpi = average diameter (taken as arithmetic average of the smallest and largest particle diameters in increment).
1.5. Average particle size
  • The average particle size for a mixture of particles is defined in several different ways.
  • Volume surface mean diameter Ds:
If number of particle Ni in each fraction is known, instead of mass fraction xi, then:

  • Arithmetic mean diameter: NT = number of particles in the entire sample


  • Mass mean diameter:
  • Volume mean diameter:
  • For sample consisting of uniform particles these average diameters are, of course, all the same. For mixture containing particle of various sizes, however, the several average diameters may differ widely from one another.
1.6. Number of particles in mixture
  • The volume of any particle is proportional to its "diameter" cubed.

a = volume shape factor Assuming that a is independent of size, then:

1.7 Screen analysis
  • Testing sieves are made of woven wire screens.
  • Openings are square.
  • Screens are identified by Mesh No.
  • Mesh No. is the numbers of opening per linear inch.
  • Area of opening in any screen = 2 x Area of opening in next smaller screen.
  • Mesh dimension of any screen = 1.41 x Mesh dimension of next smaller screen. 
  • Standard screens are used to measure the size (and size distribution) of particles in the size range between about 3 and 0.0015in (76mm and 38m m).
  • Testing sieves are made of woven wire screens, the mesh and dimensions of which are carefully standardized.
  • The openings are square.
  • Each screen is identified in mesh per inch, e.g. 10mesh, Dpi = 1/10 = 0.1in.
  • The actual openings are however smaller than those corresponding to the mesh number, because of thickness of wire.
  • The area of the openings in any one screen in the series is exactly twice to that of the openings in the next smaller screen. The ratio of the actual mesh dimension of any screen to that of the next smaller screen is   =1.41.
  • For close sizing, intermediate screen are available, each of which has a mesh dimension  = 1.189 times that of next smaller standard screen.
  • Analysis using standard screen: Screens are arranged serially in a stack, with the smallest mesh at the bottom and the largest at the top. Materials are loaded at top and then shacked for a period of time (e.g. 20 minutes).
  • Any particle that passed  the finest screen are caught in the pan at the bottom of stack.
  • The particles retained of each screen are removed, weighed  and masses of individual screen increments are converted into mass fraction of total sample.
  • Any particle that passed  the finest screen are caught in the pan at the bottom of stack.
  • The results of screen analysis are tabulated to show the mass fraction of each screen increment as a function of the mesh size range of the increment.
  • The notation 14/20 means “through 14 mesh and on 20 mesh”.
  • Typical screen analysis is given in next slide.
    • First column: mesh size,
    • second column: width of opening of screen,
    • third column: mass fraction of total sample that is retained on that screen xi (where i is the number starting from the bottom of the stack),
    • fourth column: averaged particle size Dpi (since the particle on any screen are passed immediately by the screen ahead of it, the averaged of these two screen are needed to specify the averaged size in that increment).
    • Fifth column: cumulative fraction smaller than Dpi


Exercise


Minggu, 16 April 2017

TEKNOLOGI MINYAK BUMI


Oil Outline
  1. History of Use
  2. Formation of Oil
  3. Concentration of Oil
  4. Oil Recovery
  5. Oil Refining
  6. Where is the oil?
  7. How long will it last?
  8. What are the environmental Concerns?
  9. Real cost of oil

History of Use

  • 1000 A.D.  Arab scientists discovered distillation and were able to make kerosene.  This was lost after the 12th century!
  • Rediscovered by a Canadian geologist called Abraham Gesner in 1852.
  • Oil seep in California : Petroleum seep (a place where natural liquid or gaseous hydrocarbons escape to the earth's atmosphere and surface, normally under low pressure or flow). The seep began after the 1994 Northridge earthquake in the North Sulphur Mountain Area of Ojai oil field, Ventura County, CA. 
  • 1858:  first oil drilled in Canada
  • 1859:  Edwin Drake! Who is he? 
  • He was the first person in the U.S. to drill for oil , Where?  Titusville, Pennsylvania
  • Initial cost:  $20 per barrel, within three years dropped to 10 cents
  • Now why do we measure oil in barrels?
  • 1901:  Texas!  Spindletop gushed 60m high and gave 100,000 bbl a day
  • Name: Petro means rock, Oleum means oil
Oil: A Timeless Energy Source Ancient times
  • 3000 B.C.: Mesopotamians used “rock oil” in architectural adhesives, ship caulks, medicines and roads
  • 2000 B.C.: Chinese refined crude oil for use in lamps and to heat their homes Even though fossil fuels were used thousands of years ago, mass consumption of oil and gas began only “recently.”
  • 1849: Method to distill kerosene from petroleum discovered.
  • 1853: Polish chemist Ignancy Lukasiewiz discovered how to make kerosene from crude oil on an industrial scale.
  • 1859: Kerosene took over lighting market.
  • 1847: The world’s first oil well was drilled in Baku, Azerbaijan
  • 1851: Scottish chemist James Young opens the world’s first oil refinery near Edinburgh, Scotland
  • 1859: Colonel Edwin Drake drilled the first successful commercial oil well in northwestern Pennsylvania.
  • 1896: The first known offshore oil well is drilled at the end of a 300-foot wharf in Summerland, California. 
  • 1901: On January 10, Spindletop, an oil field located just south of Beaumont, Texas, produces a "gusher" that spills out 100,000 barrels of oil per day. 
  • 1917: The Bolivar Coastal field, South America’s largest oil field, discovered in Venezuela.
  • 1903: Entrepreneur Henry Ford incorporates the Ford Motor Company.
  • 1908: Ford's mass-produced Model T drives consumer demand for gasoline. 125,000 cars on US roads. Oil is found in Persia (modern Iran), leading to the formation of Anglo-Persian Oil company, the forerunner of BP
  • 1930: 26.7 million cars in the US.
  • 1938: Major oil reserves are discovered in Kuwait and Saudi Arabia
  • 1950 – present:  Oil became most-used energy source because of automobiles.
  • 1993 – present: US imports more oil than it produces - needed because of growing petroleum demand used for fuel, electricity and manufacturing plastic.
  • 2007: World uses about 86 million barrels of oil per day – 40,000 gallons every second.

Who Work on Oil and Gas?
  • The Finders
    Geoscientists  (geologists, geophysicists)
    Study the Earth to search for clues to where oil and gas might be hidden
    Analyze minerals, soil, and rocks samples
    Evaluate underground geologic structures to find oil and gas fields
    The Movers
    Petroleum engineers
    Determine best drilling methods to find oil and gas deep in the Earth
    Manage production when oil and gas are drained from underground
    Oil and Gas Refinery
    Chemical engineers
    very technical role - from process engineering to design engineering. 
    management and technical roles throughout the entire organization
    Offshore Drilling Platforms Become
     “Pit Stops” for Monarch Butterflies
    300 million monarchs fly from Canada, U.S. – spending winters in warm central Mexico
    Offshore oil-industry equipment in Gulf of Mexico offers ideal rest stop
    Monarchs attracted to structures with
    bright yellow paint

Sabtu, 15 April 2017

KULIAH KERJA NYATA ASIK DESA SEDAYU

Banyak program kerja yang bisa dilakukan mahasiswa KKN tergantung dari keadaan tempat KKN dan kemampuan mahasiswa KKNnya sendiri. Judul yang diambil dalam pelaksanaan KKN ini adalah AKSELERASI SEDAYU MENUJU MASYARAKAT EKONOMI ASEAN . Kami beranggotakan 10 orang yang berasal dari berbagai bidang ilmu dari psikologi, sastra jawa, teknik kimia, ekonomi pembangunan, akutansi, manajemen, dan ilmu hukum. Saya oki fianti dari teknik kimia hehe kenalan dulu yah :-D.

Kenalan dulu deh sama desanya hehe. Desa Sedayu merupakan salah satu desa di kecamatan Sapuran kabupaten Wonosobo yang mempunyai delapan dusun yaitu: tanjungsari, cengang, karanganyar, merapi, silempah, sumunggang, jatialit dan sedayu. Masyarakat desa Sedayu sangat ramah-ramah hehe. Mayoritas penduduknya bekerja sebagai petani dan buruh di pabrik. Di desa Sedayu terdapat tempat wisata yaitu agrowisata tanjungsari, kebun teh tambi, bambu rengkol dll.

Lanjut program kerja, program kerja kita fokus ke empat bidang yaitu pendidikan, kesehatan, ekonomi dan infrastruktur lingkungan. Bidang pendidikan progjanya ada pendidikan seks dini untuk anak-anak SD, pelatihan pranatacara untuk masyarakat umum desa Sedayu, lomba mewarnai untuk anak-anak TK, membantu kegiatan TPQ, bimbingan belajar dan motivasi, pendidikan sopan santun untuk anak-anak SD, dan pendampingan karawitan yang merupakan kegiatan rutin di dusun Tanjungsari. Bidang kesehatan progjanya antara lain bersih pemukiman dan jalan sehat yang sasaranya adalah anak-anak yang ikut dalam bimbingan belajar, pendampingan posyandu, senam ibu-ibu, pengobatan dan pemeriksaan gratis untuk seluruh masyarakat desa sedayu. Bidang ekonomi antara lain pendaftaran PIRT, E-commerce produk kerajinan, dan pelatihan pembuatan lilin. Selanjutnya adalah bidang lingkungan dan infrastruktur progjanya antara lain kerja bakti sedayu, sosialisasi pemanfaatan halaman pekarangan rumah dan pembuatan pupuk organik, go green Sedayu penanaman 2000 pohon. Alhamdullilah semua program kerja hampir terlaksana dengan baik berkat ridho Allah, bantuan dan kerjasama dari semua pihak. Banyak pelajaran dan pengalaman yang kita dapat setelah melakukan KKN ini. Selain melakukan program kerja tersebut kita juga bisa liburan di daerah dataran tinggi dieng yang indah dan sejuk.

Berikut dokumentasi kegitan kuliah kerja nyata desa Sedayu dan jalan-jalan di desa sedayu dan dieng.